


![BlueChart g2 - HPC411S - Geraldton-Darwin 2014.0 [15.50]](https://www.hostdel.com/banners/Hosting/728x90.gif)
Results 1 to 1 of 1
-
29th March 2014, 04:04 AM #1
 Garmin Master

 BlueChart g2 - HPC411S - Geraldton-Darwin 2014.0 [15.50]
BlueChart g2 - HPC411S - Geraldton-Darwin 2014.0 (15.50)
See your vessels precise, on-chart position in relation to navaids, coastal features, anchorages, obstructions, waterways, restricted areas and more with this detailed marine mapping data.
- Shaded depth contours, coastlines, spot soundings, navaids, port plans, wrecks, obstructions, intertidal zones, restricted areas and IALA symbols.
- Seamless transitions between zoom levels and more continuity across chart boundaries.
- Standard 2-D direct overhead or 3-D over the bow map perspective for easy chart reading and orientation.
- Safety Shading* enables contour shading for all depth contours shallower than your defined safe depths.
- Fishing Charts* to scope out bottom contours and depth soundings with less visual clutter on the display.
- Plan and organize routes from your computer with HomePort (sold separately).
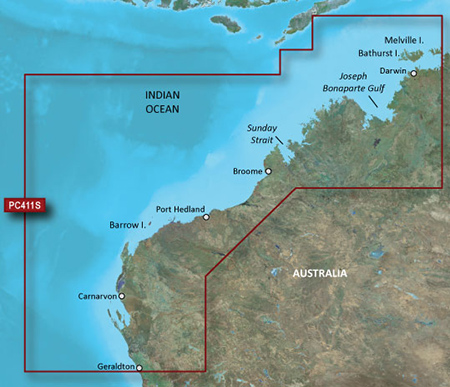
Coverage
Detailed coverage of the Northwest coast of Australia from Geraldton to Darwin. Also includes detailed coverage of Carnarvon, Port Hedland, Broome, Joseph Bonaparte Gulf, as well as Melville and Bathurst Islands.
FID: 3259, PID: 1, RID: 5, VID: 22
Locked Image:
UnLocked Image:
 p33dro Reviewed by p33dro on . BlueChart g2 - HPC411S - Geraldton-Darwin 2014.0 [15.50] BlueChart g2 - HPC411S - Geraldton-Darwin 2014.0 (15.50) See your vessels precise, on-chart position in relation to navaids, coastal features, anchorages, obstructions, waterways, restricted areas and more with this detailed marine mapping data. Shaded depth contours, coastlines, spot soundings, navaids, port plans, wrecks, obstructions, intertidal zones, restricted areas and IALA symbols. Seamless transitions between zoom levels and more continuity across chart boundaries. Rating: 5When nothing goes right, go left.
![BlueChart g2 - HPC411S - Geraldton-Darwin 2014.0 [15.50]](https://www.hostdel.com/banners/RDP/300X250.gif)

 Register To Reply
Advertisements
![BlueChart g2 - HPC411S - Geraldton-Darwin 2014.0 [15.50]](https://www.hostdel.com/banners/Dedicated/728x90.gif)
Suggested Articles:
![BlueChart g2 - HPC411S - Geraldton-Darwin 2014.0 [15.50]](https://www.hostdel.com/banners/GameServer/728x90.gif)
Similar Threads
-
BlueChart g2 - HEU055R - Finnish Lakes 2014 [15.50]
By PiEtU in forum Garmin ArchivesReplies: 3Last Post: 5th March 2023, 05:07 PM -
BlueChart g2 - HEU055R - Finnish Lakes 2014 [15.50]
By PiEtU in forum Garmin MapsReplies: 1Last Post: 14th August 2014, 12:34 AM -
BlueChart g2 - HPC411S - Geraldton-Darwin 2014.0 [15.50]
By p33dro in forum Garmin MapsReplies: 0Last Post: 29th March 2014, 04:04 AM -
BlueChart g2 - HPC411S - Geraldton-Darwin
By p33dro in forum Garmin ArchivesReplies: 0Last Post: 9th December 2012, 11:02 AM -
BlueChart g2 - HPC411S - Geraldton-Darwin
By p33dro in forum Garmin MapsReplies: 0Last Post: 9th December 2012, 11:02 AM

![BlueChart g2 - HPC411S - Geraldton-Darwin 2014.0 [15.50]](https://www.hostdel.com/banners/Email/300X250.gif)


 Staff Online
![BlueChart g2 - HPC411S - Geraldton-Darwin 2014.0 [15.50]](https://www.hostdel.com/banners/Dedicated/300x600.gif)
iGO HERE 2022.Q2 Midle East
I would like to request the RAR password